A connector failure can interrupt an entire production sequence, so its impact goes beyond the time required to replace a component. Calculating the cost of unplanned downtime from connector failure starts with production lost during the stoppage, measured using contribution margin rather than gross revenue alone. Add relevant idle labour, material waste and restart impacts to build a more useful estimate.
It is easy to focus on visible lost output. The fuller picture also depends on how often failures occur, how long recovery takes and whether production can be recovered later. These details help distinguish a brief interruption from a recurring source of annual exposure.
This article explains how to estimate lost production and contribution margin, include other direct effects, and model annual downtime exposure using incident frequency and duration. It also shows how to compare a prevention investment with potential savings, and how application engineering and slip ring selection can help address connector-related risks.
Key Takeaways
- Use contribution margin, not gross revenue alone, to estimate production value lost during a stoppage.
- Build a fuller downtime estimate by accounting for idle labour, wasted material, restart effects and other disruption.
- Estimate annual exposure by combining failure frequency with average downtime duration and the cost of each event.
- Compare prevention investment with modelled savings using your own incident history and production data.
- Connector selection depends on application requirements such as circuit count, current, voltage, speed, mounting style and operating environment.
Lost production revenue and contribution margin
A connector failure can stop a production line even when other equipment remains operational. To estimate lost production value, identify the affected output rate and how long the line cannot run. Then distinguish revenue from contribution margin. Revenue represents sales value; contribution margin is the revenue remaining after variable production costs. Margin is a more useful measure of the production value forgone during the stoppage.
For a line producing a consistent volume, multiply its output per hour by the contribution margin per unit. This gives the contribution lost for each stopped hour. For a partial stoppage, use the output actually affected rather than the capacity of the whole plant. If production can be recovered later, record the recovered volume separately instead of counting it as permanently lost.
When calculating the cost of unplanned downtime from connector failure, include the average incident duration and the production rate during each event. A practical approach is to record the connector failure, stop time, restart time and affected output. This creates a consistent basis for comparing events and separating lost contribution from gross revenue that may be recovered through later production.
Idle labour is another factor. Record which employees could not do productive work while the line was stopped, then separate genuinely idle time from maintenance, cleaning or other useful tasks. For example, a production crew may remain on shift during a connector-related stop, while some staff support the response and others wait for the line to restart. Record each group’s time accurately.
Material waste can add to the impact. Identify in-process materials that became unusable during the interruption, along with any product requiring rework or disposal. A batch left partway through a production stage may need extra processing or may fail quality requirements. Record the quantity and disposition for each incident rather than treating all material on the line as scrap.
Employee productivity can also change after a stoppage. A delayed run may require rescheduling work, extending tasks across later shifts or diverting employees from other production. Compare planned output with completed output after recovery. This helps show whether the interruption reduced total production or simply shifted it to another period.
Estimate indirect effects by reviewing affected orders, customer communications and contract terms. Record any documented contractual penalties linked to late delivery, and track cancellations, complaints or reduced repeat orders as indicators of lost customer trust. Separate observed impacts from possible future effects. Monitoring them over time makes the estimate more grounded.
Combine these records by incident: lost contribution, idle labour, wasted or reworked materials, and documented delivery impacts. This gives a clearer view than production revenue alone, while distinguishing immediate lost output from consequences that emerge later.
How do you calculate the cost of downtime?
Build the estimate from recorded incidents, separating hardware faults from other causes. Then compare the operational losses and recovery work associated with each cause.
Hardware Failures as Downtime Causes
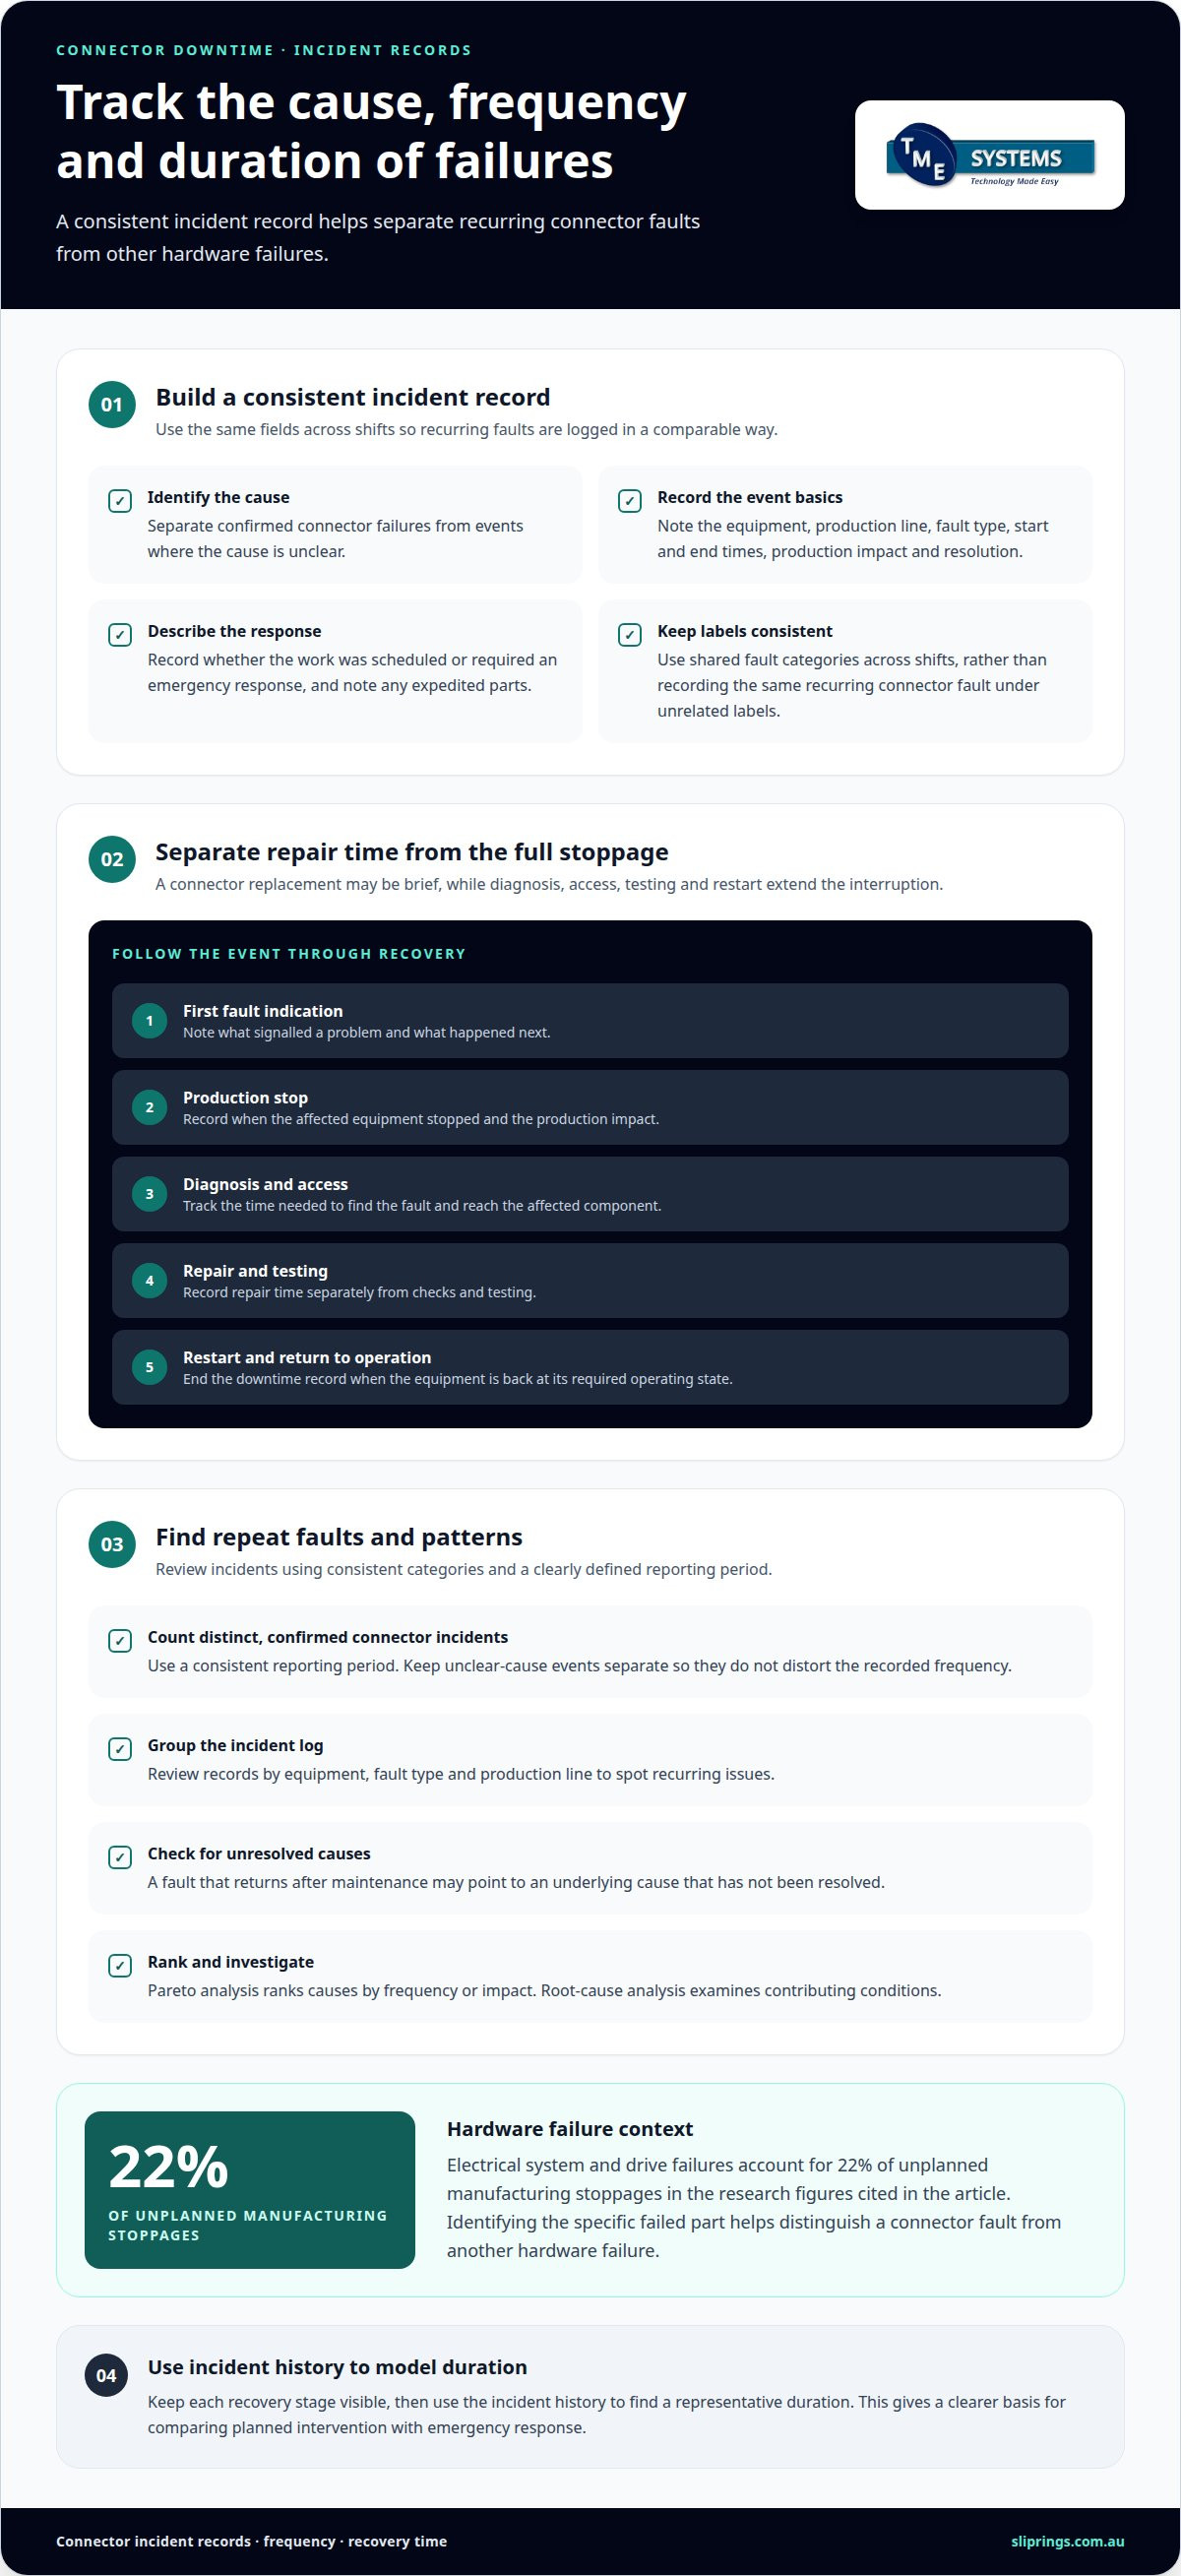
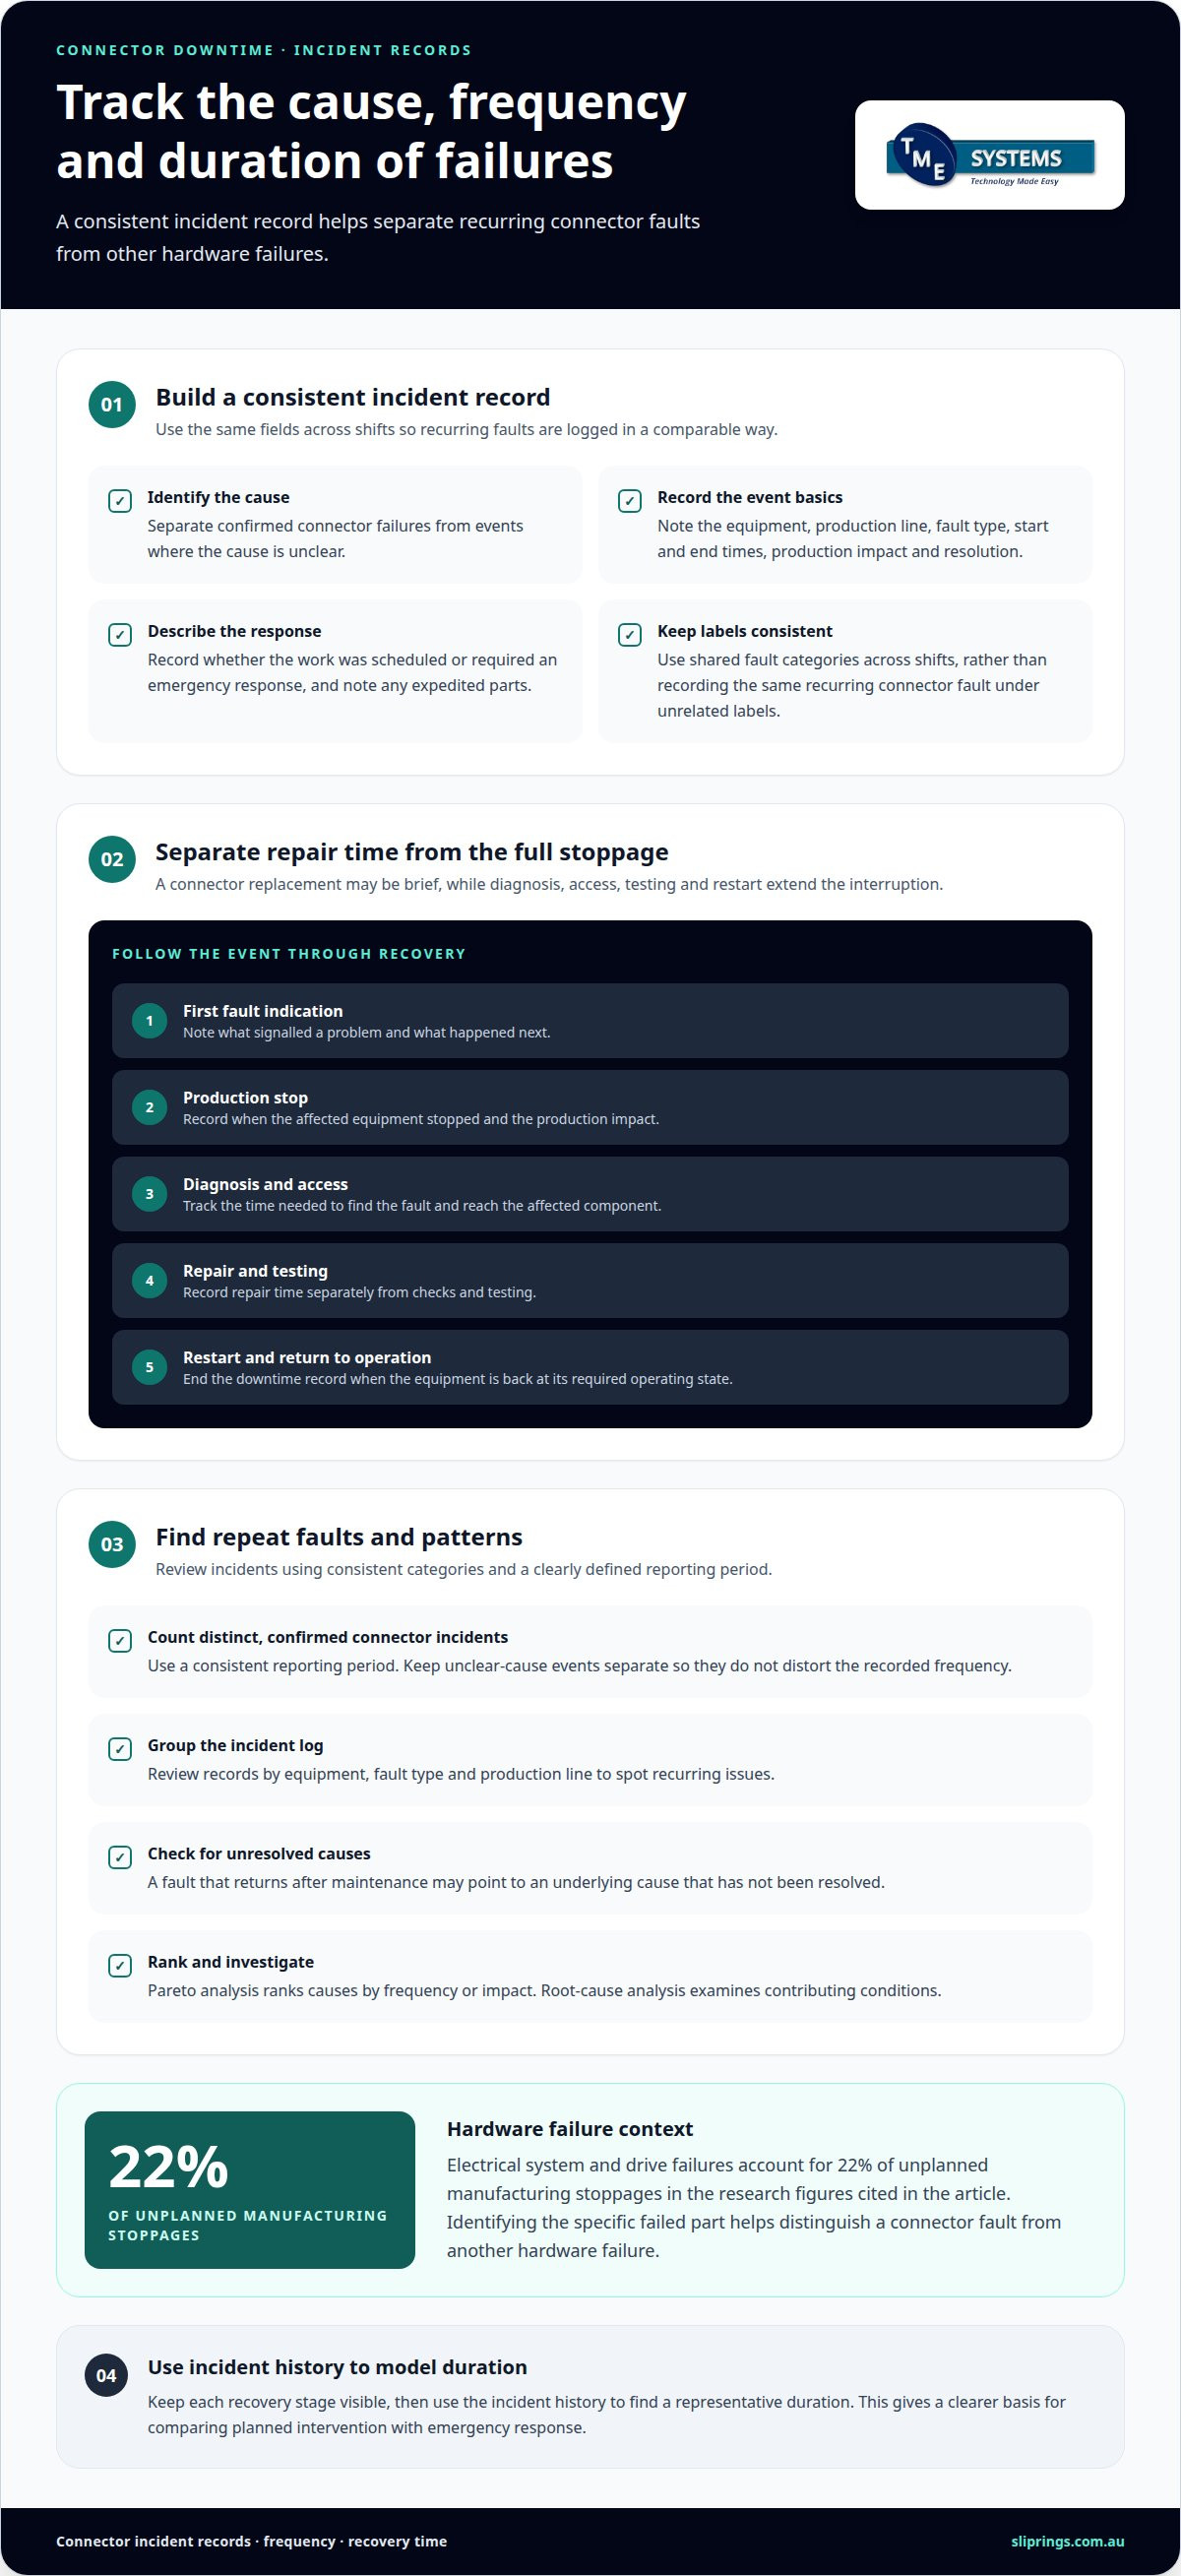
Hardware failures are physical faults that interrupt a machine’s ability to operate, such as a damaged electrical connection or failed drive component. Electrical system and drive failures account for 22 percent of unplanned manufacturing stoppages in the research figures provided. Identifying the specific failed part matters because a connector fault may need a different corrective response from a motor or control-system failure; similarly, for sites managing electric vehicle infrastructure, choosing robust hardware from suppliers like Charging Shop helps prevent connector faults and service downtime.
Trace the event from the first fault indication through restart. For example, record whether a rotating electrical connection lost continuity before the equipment stopped, or whether another component failed first. That sequence helps distinguish a primary hardware cause from damage or alarms that followed.
Documenting Downtime Causes and Patterns
Downtime documentation is a consistent incident record covering the cause, start and end times, production impact and resolution. Use the same fields across shifts so a recurring connector fault is not recorded under several unrelated labels. Include whether the response involved scheduled work, emergency intervention or expedited parts, as each can affect recovery time and operational losses.
Review the incident log by equipment, fault type and production line. A repeated fault after maintenance, for example, may indicate an unresolved underlying cause rather than a new failure. Pareto analysis ranks causes by frequency or impact, helping identify which categories account for the largest share of recorded downtime. Root-cause analysis then examines those categories for contributing conditions.
Estimating Connector Failure Frequency and Duration
Estimate failure frequency by counting distinct connector-related incidents within a consistent reporting period. Separate confirmed connector failures from events with an unclear cause; otherwise, the rate may misdirect maintenance planning. For duration, use the elapsed time from the production stop until the affected equipment returns to its required operating state.
Keep repair time separate from the total production interruption. Replacing a connector may be brief, while diagnosis, access, testing and restart extend the stoppage. Record each stage separately, then use the incident history to find a representative duration for modelling. This gives a clearer basis for comparing planned intervention with emergency response.
Combine incident frequency, average duration and the losses linked to each event to estimate downtime costs. Include output impact, labour disruption, waste and recovery work, while avoiding double-counting costs already included in production figures. Reviewing connector application variables can also help frame which operating conditions belong in the failure analysis.
Prevention investment and modelled ROI
A prevention model tests whether a proposed maintenance action could reduce the operational impact of connector failures. Its value depends on how closely the assumptions reflect the equipment’s actual duty. Separate observed results from projections, and state which operating conditions the model covers. This supports planning without presenting a possible improvement as a certain outcome.
Postmortems can turn each incident into a specific prevention decision. Examine what changed before the failure, how it was detected and whether the existing maintenance program addressed that condition. Then define an action with a clear purpose, such as reviewing an inspection method or changing a scheduled task. The action should address a suspected cause, not simply repeat the repair.
Assess preventability carefully. A fault may be avoidable through a maintenance change, while another may depend on operating conditions outside the program’s control. Classify incidents according to the available evidence, and avoid treating every connector failure as preventable. This keeps projected benefits grounded and helps teams focus on causes they can influence.
For an ROI comparison, set out the proposed program’s resource requirements alongside the operational effects it aims to reduce. Include planned labour and any production interruption associated with the work. Model alternative cases using different assumptions about how the action might affect failure recurrence or recovery. Do not combine the most favourable assumption with the most favourable incident history unless the scenario explains why.
Account for consequences that could affect the decision, including documented delivery penalties, emergency repairs or secondary damage. Keep each item separate so the analysis shows which assumptions drive the result. If an expense is already included in another measure, do not count it again. A clear breakdown makes the comparison easier for maintenance, production and finance teams to review together.
After introducing an action, compare subsequent operating records with the model’s assumptions. Consider whether the relevant equipment experienced similar duty and whether the maintenance task was completed as planned. If conditions changed, note that before interpreting the outcome. A period without a failure does not, by itself, establish that the action caused a reduction.
Use the review to refine the program: retain actions supported by evidence, adjust those that miss their intended purpose, and investigate recurring failures further. This creates a practical decision cycle that links incident learning to planned prevention and a transparent assessment of potential return.
Annual unplanned downtime cost calculation
Annual exposure combines how often connector failures occur, how long production is interrupted, and the impact per unit of downtime. Use the same reporting period for every input. A practical model is: annual incidents × average downtime duration per incident × production impact per downtime hour. Add other recorded effects separately, without counting them twice.
Start with the incident log. Filter for connector-related failures, then total the production interruption time across the year. If operating schedules vary, compare failures with the relevant production calendar rather than assuming every hour affects output equally. Keep planned downtime separate: scheduled maintenance is not an unplanned connector failure, even if both reduce available production time.
For each event, calculate direct production impact using the affected line’s contribution per operating hour. Where production was later recovered, distinguish delayed output from output that was permanently lost. This prevents the annual estimate from treating all stopped production as unrecoverable. Apply one consistent method across events so comparisons remain meaningful.
Next, add incident-specific effects supported by operational records. These may include idle labour, scrap, rework, expedited recovery activity, delivery penalties or secondary equipment damage. Use maintenance reports for repair impacts, quality records for waste, and order records for delivery consequences. Keep each source distinct, then check that production losses do not already include the same scrap or rework.
Connector failure frequency can vary with operating conditions. Segment annual records by equipment, production line or relevant operating environment when those factors differ. For example, a line with repeated connector-related stops should not be averaged with unaffected equipment if that would conceal its exposure. Retain both the overall annual figure and the segment detail.
Present the result as a range when incident duration or production impact varies substantially between events. A lower scenario can use typical recorded conditions; an upper scenario can reflect longer recovery or greater affected output found in the incident history. Keep assumptions visible, and avoid adding unsupported penalties or damage estimates.
Finally, compare the annual unplanned figure with planned downtime and review the underlying records periodically. A change in failure frequency, recovery duration or production schedule changes the result. The key point is that an annual estimate is only as useful as its incident classification, operating context and treatment of recovered output.
How to estimate downtime duration and failure frequency for connectors?
Estimate connector failure frequency from recorded events, and downtime duration from the full interruption until production is restored. Separate the connector fault from diagnosis, repair, testing and restart so the model reflects operational time, not component replacement alone.
Count distinct connector-related failures across a consistent operating period. Divide that count by the relevant operating exposure, such as the production hours logged for the equipment. Keep the equipment and operating conditions identifiable. A combined site-wide average can hide repeated failures on one line or connector assembly.
For each incident, record when production stopped and when the equipment returned to its required operating state. Note when the fault was detected, when diagnosis began, when repair finished and when production restarted. These timestamps show whether the longest delay came from fault-finding, access, repair, testing or restart. They also separate repair duration from the production interruption.
Mean time between failures (MTBF) describes operating time between failures; mean time to repair (MTTR) describes average repair time. Together, they can support an availability estimate: MTBF divided by the sum of MTBF and MTTR, multiplied by 100%. A worked example using MTBF of 500 hours and MTTR of 4 hours gives 99.2% availability.
Compare that with a reactive-facility example using MTBF of 200 hours and MTTR of 8 hours, which gives 96.2% availability. These examples show how longer repair time and shorter time between failures affect availability. They are illustrations, not assumed performance figures for a particular connector or production line.
Use incident records to select a representative duration for planning. If one event involved an unusual delay, retain it in the history but identify its cause separately. A typical duration can support a baseline, while the longest recorded duration helps test a more demanding scenario. Apply the same method when comparing equipment or periods.
Connector-related downtime may include time spent confirming the failure, sourcing a replacement, completing the repair and validating operation. Record these stages separately, as each points to a different improvement opportunity. For example, quicker fault identification will not reduce production interruption if restart testing remains the longest stage.
Review frequency and duration together. A connector with infrequent faults but lengthy recovery may need a different response from one with frequent, brief interruptions. Discuss connector application requirements to relate operating conditions and technical selection to your failure analysis.
TME Systems’ slip ring and application engineering support
TME Systems connects downtime analysis with rotary electrical connector selection through technical application consulting. This can support a review when incident records point to a recurring connection fault, or when a new design needs a rotary electrical joint suited to its operating conditions. Selection considers circuit count, current, voltage, speed, mounting style and environmental requirements.
Prosper Rotation Slip Rings are one option within the product range. The application requirements, not the brand name alone, guide the selection. Prosper Rotation slip rings can be considered alongside other available ranges when assessing the required electrical and mechanical characteristics.
Mounting constraints also affect selection. Shaft arrangement, available space and cable routing can influence whether a through-bore or end-of-shaft configuration suits the equipment. Technical application consulting can consider those mechanical details alongside electrical requirements. Where a standard arrangement does not suit the design, application engineering can assess the need for a custom configuration.
Contact technology is another consideration. Liquid metal rotary connectors are brushless rotary connectors that use a pool of conductive liquid metal to maintain electrical continuity, eliminating wear and reducing noise. collector ring vs slip ring selection depends on the duty: collector rings are heavy-duty rotary connectors designed for high current capacity, whereas standard slip rings are typically optimised for signal integrity and lower currents.
Some installations have specific environmental requirements. If an application calls for an explosion-proof slip ring, that requirement belongs in the technical review alongside the equipment and operating conditions. AS/NZS 5368:2025 can also be considered as a relevant reference point in the Australian engineering discussion. It should be considered in context with the application requirements, rather than treated as a substitute for engineering review.
A final engineering review brings the application requirements together before selection. It can assess whether the proposed connector’s electrical, mechanical and environmental parameters align with its intended duty. This is useful after connector-related interruptions or when operating conditions change and the original selection needs reassessment.
For an application review, contact TME Systems with the equipment and connector requirements.
Turn the downtime estimate into an engineering decision
Use the estimate to decide whether the connector application needs review. A useful next step is to connect incident records with the equipment’s electrical, mechanical and environmental requirements. Modelled savings are estimates, not guaranteed outcomes, so keep assumptions visible as operating conditions change.
When calculating the cost of unplanned downtime from connector failure, the purpose is not just to assign a loss. It is to identify where a better-matched rotary electrical connection or a revised application specification could reduce exposure. TME Systems offers Mercotac Slip Rings, Meridian Laboratory Slip Rings and BGB Innovation Slip Rings, alongside technical application consulting to support selection against the application requirements.
Bring the failure pattern, operating conditions and connector requirements into the discussion. That gives the engineering review a clear starting point and helps focus on the factors most relevant to production continuity. Contact TME Systems about connector reliability to discuss the next step for your application.
Frequently Asked Questions
How to calculate the total cost of unplanned downtime from a connector failure?
Set a clear boundary for the incident before compiling its financial effect. Decide which production line, orders and recovery period belong to the event, then reconcile operational records with finance records. This avoids mixing impacts from separate stoppages or reporting one consequence twice. Keep estimates separate from amounts recorded in accounts, so decision-makers can see which figures are actual and which are modelled.
What production, labour and revenue losses should be included in downtime cost calculations?
Distinguish lost sales from lost contribution, and separate both from fixed expenses that continue during a stoppage. Also consider whether the affected equipment is a production bottleneck: an interruption there may constrain downstream output, while a stoppage elsewhere may not. For labour, classify time by work performed and payroll treatment. This makes the estimate more useful for operational decisions than treating every paused activity alike.
How do connector failures cause equipment or production downtime?
A connector can interrupt the electrical path between stationary and rotating equipment. The effect may be a complete stop, an intermittent fault or a disruption to a signal needed for operation. For example, a control signal that drops out may affect operation without the connector visibly breaking. Fault alarms and machine logs can help establish whether the connector event preceded the equipment response. Where production lines rely on wireless telemetry or industrial mobile links, maintaining resilient RF hardware and cables through telcoantennas.com.au helps avoid similar signal-related stoppages.
How to calculate repair labour, contractor and troubleshooting costs during connector failure?
Use approved timesheets and contractor invoices as primary records, and assign each entry to the relevant incident. Separate direct work from general supervision or unrelated maintenance, following the site’s normal accounting method. If an employee’s hours are also included in an idle-labour calculation, do not count them again as repair labour. This classification gives finance and maintenance teams a consistent basis for reviewing the event.
What are the costs of scrap, rework and delayed orders caused by connector failure?
Link affected material and orders to traceable production or dispatch records. Quality documentation can show whether a product was scrapped, reworked or released after inspection; order records can identify affected deliveries. Keep recovery actions, such as revised dispatch arrangements, attached to the relevant order. This creates an auditable link between the equipment event and the customer-facing outcome without assuming every delay led to a penalty.
How does preventive connector maintenance compare with the cost of unplanned downtime?
First assess whether the suspected failure mode can be detected or reduced through a planned maintenance task. A schedule is more relevant when the task can address a recognised degradation mechanism; it may be less useful when the cause is unrelated to routine inspection. Compare the proposed task’s operational burden with the failure exposure it targets, then review maintenance findings to confirm the task remains technically relevant.
What data and formula can businesses use to compare connector failure downtime costs across sites?
Standardise event definitions before comparing sites: agree what counts as a connector failure, when downtime starts and ends, and which production losses are reported. Then present each site’s results against a consistent operating basis, such as its recorded equipment operating hours, with production mix shown separately. Keep currency, accounting treatment and data periods consistent. These controls help distinguish genuine performance differences from differences in local reporting.